


Signage ROI South Africa: Measure Business Impact
Most corporate decision-makers in South Africa sign off on signage spend without any plan to measure what they get back. The instinct is understandable: signage feels like a fixed overhead cost rather than a trackable marketing channel. That thinking is expensive. Signage ROI in South Africa is measurable, it compounds over time, and the businesses that track it make smarter investment decisions than those that simply renew orders year after year based on habit. This article gives you a practical, numbers-first framework for measuring the business impact of your corporate signage investment, whether you are managing a single retail outlet, a national franchise network, or a multi-site hospitality group.
Table of Contents
- Quick Takeaways
- Why Signage ROI Is Undertracked in Corporate South Africa
- The Core ROI Formula for Business Signage
- Key Metrics for Measuring Signage Effectiveness
- Signage ROI by Business Type: What to Realistically Expect
- Measuring Brand and Franchise Signage Impact
- Signage Measurement Methods Compared
- Common Mistakes That Distort Your Signage ROI
- Frequently Asked Questions
- References
Quick Takeaways
| Key Insight | Explanation |
|---|---|
| Use the standard ROI formula from day one | ROI equals total benefits minus total costs, divided by total costs, multiplied by 100. Set your baseline before installation, not after. |
| Cost-per-impression (CPI) is your most defensible metric | Divide total signage cost by estimated impressions (foot traffic multiplied by display exposure probability). Business signage typically delivers among the lowest CPI of any marketing channel. |
| Retail and hospitality break even fastest | Well-executed signage in retail and restaurant environments commonly reaches breakeven within 6 to 12 months, while corporate and healthcare venues tend to take longer because returns come through operational savings. |
| Franchise signage ROI requires centralised tracking | Tracking performance site-by-site without a centralised framework produces noisy, incomparable data. Franchisors need standardised KPIs across all locations to make valid comparisons. |
| South Africa's signage market is growing faster than the global average | South Africa's digital signage segment is expanding at roughly 8% CAGR, above the global rate, signalling increasing competition for attention and a rising premium on quality placement. |
| Brand recall is a hard metric, not a soft one | Customer surveys run 30 days post-installation give you a measurable recall rate. A lift in unaided brand recall translates directly into future purchase intent and reduced advertising spend needed to maintain awareness. |
| Operational savings are part of the ROI calculation, not a bonus | For corporate lobbies, menu boards, and wayfinding systems, reduced staff time spent on directions and repeated enquiries is a real, quantifiable cost saving that belongs in your ROI spreadsheet. |
Why Signage ROI Is Undertracked in Corporate South Africa
The most common reason signage ROI goes unmeasured is that signage spend often lives in a facilities or operations budget rather than a marketing budget. Nobody is accountable for demonstrating return, so nobody measures it. This is particularly common among franchises and multi-site retail groups where the original corporate identity rollout was a once-off capital expense.
A second reason is the mistaken belief that signage impact is too diffuse to isolate. In practice, that is only true if you do not set a baseline before installation. Businesses that record foot traffic counts, average transaction values, and enquiry volumes for four to eight weeks before new signage is installed have a clean before-and-after comparison. Those that skip this step are correct: their data will be too noisy to be useful.
South Africa's commercial signage environment is becoming more competitive, not less. As more retailers, hospitality groups, and corporate campuses invest in higher-quality displays, the opportunity cost of poorly placed, poorly measured signage rises. The businesses winning on signage ROI right now are treating their signs the same way they treat any other marketing investment: with defined objectives, baseline data, and a review cadence.
Pro tip: Before your next signage installation or refresh, spend two weeks logging your current foot traffic, enquiry volumes, and average transaction values by location. This baseline is the single most valuable data set you will ever have for proving signage impact.
The Core ROI Formula for Business Signage
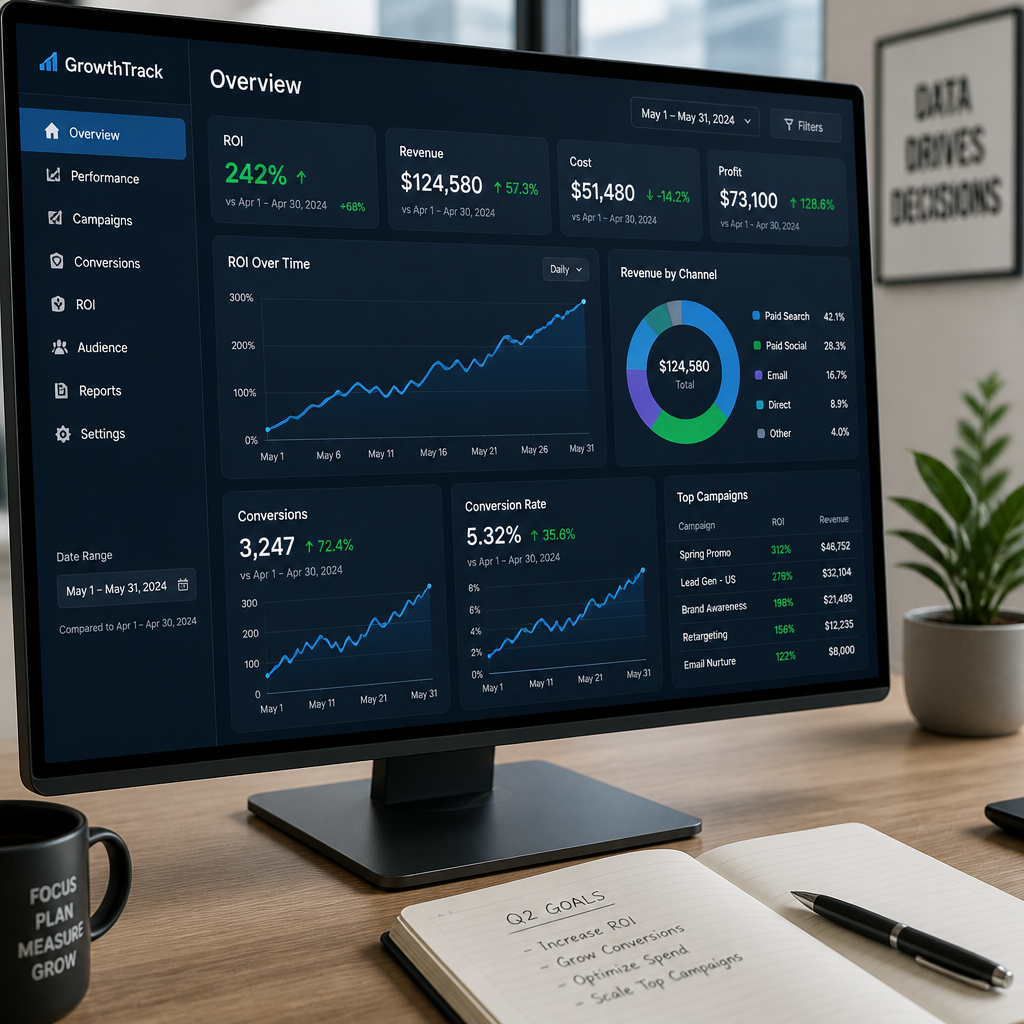
The formula itself is not complicated. ROI equals total benefits minus total costs, divided by total costs, multiplied by 100. What makes it hard is being honest and comprehensive about both sides of that equation.
What belongs in "total costs"
Total costs must include design, fabrication, installation, any necessary structural modifications (mounting points, electrical supply for illuminated signs), and ongoing maintenance. For LED-backlit signs, pylon signage, and channel lettering, the installation and structural costs are often underestimated. For rental signage arrangements, include the full rental term cost across the measurement period.
A common mistake is to count only the purchase price of the sign itself and ignore installation labour, which on complex fascia or pylon installs in Gauteng can represent 20 to 35 percent of the total project cost. That omission inflates your apparent ROI and makes future budget decisions unreliable.
What belongs in "total benefits"
Total benefits fall into three categories: direct revenue lift, cost savings, and brand equity gains. Direct revenue lift is the easiest to measure: compare average weekly sales or transaction volumes before and after installation, controlling for seasonality. Cost savings apply most clearly to operational signage such as wayfinding systems, menu boards, and lobby directories, where reduced staff time on repeated enquiries is a genuine saving. Brand equity gains are harder to quantify in rand terms but are measurable through recall surveys and net promoter score tracking.
The discipline of defining success upfront is what separates venues that can prove their signage works from those that simply believe it does. Networks without targets often produce attractive engagement numbers but lack the data that justifies the next round of investment.
Key Metrics for Measuring Signage Effectiveness
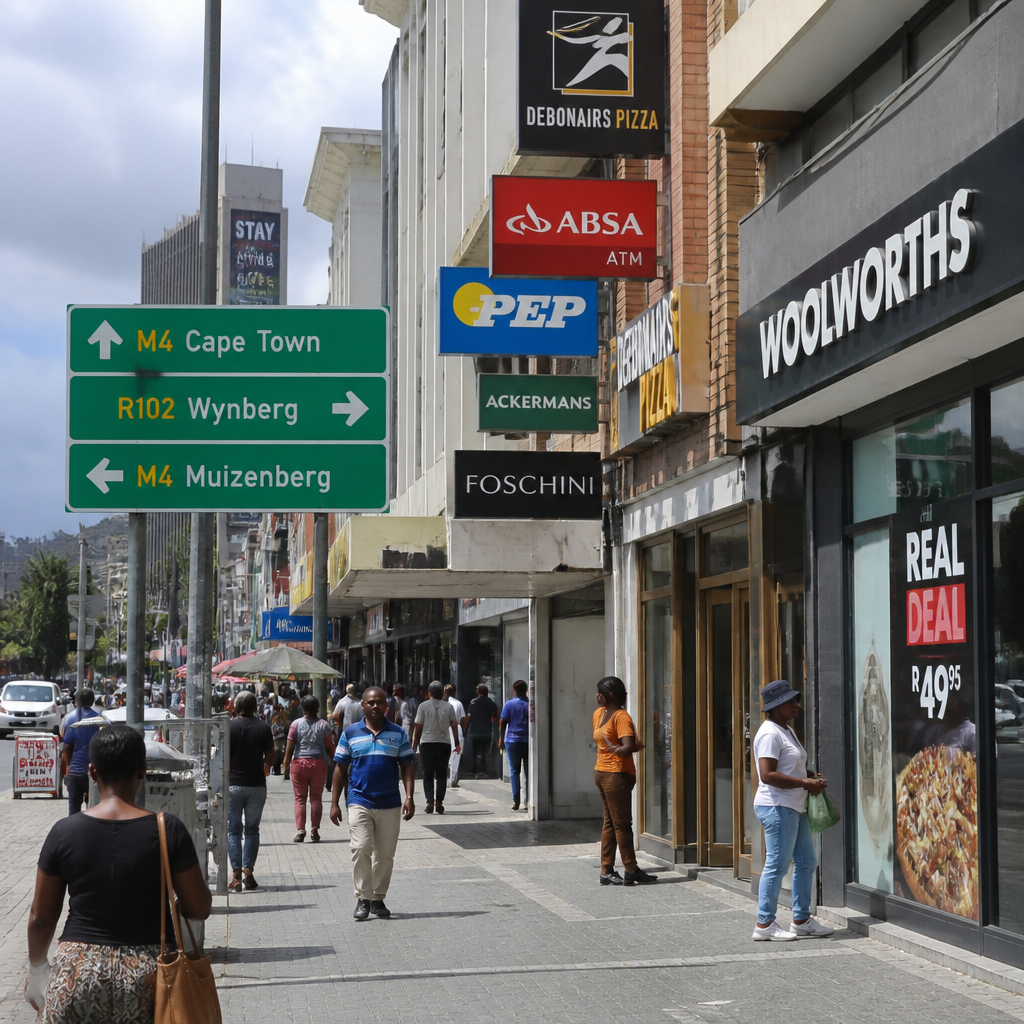
Measuring signage effectiveness requires more than one number. Different sign types serve different purposes, and the metrics you track should match the purpose of the sign. A pylon sign on a busy arterial road does a different job from a channel-lettered fascia sign above a retail entrance, which does a different job from a lobby display inside a corporate headquarters.
Foot traffic lift
Foot traffic lift measures the percentage increase in visitors to a location after signage installation. It is best tracked using entry counters or point-of-sale transaction data as a proxy. For roadside and pylon signage specifically, you can also track an increase in first-time visitors who mention they found the business by driving past, which you can capture at the point of sale with a simple "how did you find us?" field.
Cost-per-impression (CPI)
CPI is calculated by dividing the total cost of the signage by the estimated number of impressions it generates. An impression is one person seeing your sign. You estimate this by multiplying the daily foot or vehicle traffic past the sign by a display exposure probability factor (typically 0.6 to 0.8 for well-placed, visible signage). Business signage consistently delivers among the lowest CPI rates of any marketing channel, which makes it particularly strong to present to a CFO or marketing director who is accustomed to comparing media buys.
Sales uplift and conversion rate
Sales uplift is the most direct financial metric. Compare average weekly revenue for an equivalent period before and after installation. Conversion rate applies where you can track both visitors and purchases separately, such as in retail. If your retail location saw 1 200 visitors per week before and 1 450 after new fascia signage, and your conversion rate held steady, the uplift in transactions is directly attributable to the signage-driven foot traffic increase.
Brand recall rate
Brand recall is measured through customer surveys. Run a short survey with a sample of your target audience in the catchment area, asking them to name your business unaided, then compare results before and after installation. Tracking recall rates shows how well viewers remember your signage and correlates directly with future purchase intent. For corporate environments, this translates into faster recognition in a competitive shortlist situation.
Enquiry volume and source attribution
For B2B corporate clients and professional service businesses, the most practical metric is enquiry volume. Track inbound enquiries by source and include a "signage or premises" option. Over six to twelve months, this gives you a reliable picture of how much new business pipeline is being influenced by your physical brand presence.
Signage ROI by Business Type: What to Realistically Expect
Not every business type sees the same ROI timeline or the same type of return. Setting the right expectations for your sector prevents the common error of abandoning a sound signage investment before it has had time to perform.
Retail and quick-service restaurants see the fastest payback. When signage is well-placed and clearly visible from passing traffic, breakeven in six to twelve months is achievable. The mechanism is straightforward: better visibility drives more walk-in traffic, which converts at the existing store conversion rate. Every additional walk-in is net revenue.
For hotels and hospitality venues, the return mechanism is slightly different. Signage drives top-of-mind awareness and wayfinding, both of which contribute to booking volume and guest experience scores. The payback period is typically twelve to eighteen months, but the brand equity gain is ongoing and compounds across multiple guest review cycles.
For corporate headquarters and office parks, the primary return is not direct sales but operational savings and brand credibility. Well-executed lobby signage, directional systems, and exterior corporate identity displays reduce visitor confusion, cut receptionist time spent on basic wayfinding, and materially improve first impressions with clients and talent. These are genuine financial benefits, and they belong in any honest ROI calculation for this sector.
Fitness centres and gyms occupy an interesting middle ground. Exterior signage directly drives membership enquiries, while interior motivational and branding signage contributes to member retention. Measuring both separately gives a more complete picture than lumping all signage into one line item.
Measuring Brand and Franchise Signage Impact
For franchise operators and multi-site corporate groups, the ROI question gets more complex because signage serves two simultaneous purposes: driving local site performance and maintaining the integrity of the broader corporate identity (CI). Conflating these two purposes leads to measurement frameworks that are neither fish nor fowl.
Site-level performance tracking
Each site in a franchise network should track the same set of KPIs: foot traffic, average transaction value, conversion rate, and new customer acquisition rate. When all sites use the same metrics, you can compare performance across locations and identify whether underperformers are being dragged down by poor signage visibility, poor placement, or CI non-compliance. This is the operational case for centralised signage management by a provider that understands franchise CI requirements.
Corporate identity compliance as a revenue driver
CI non-compliance is not just an aesthetic problem. When a franchise location operates with faded, damaged, or off-spec signage, it signals to passing customers that the business is poorly managed. Research consistently shows that visual brand consistency across locations is one of the strongest drivers of customer trust in franchise environments. Tracking CI compliance rates across your network and correlating them with site-level NPS scores gives you a direct, defensible link between signage standards and business performance.
Pro tip: For franchise networks with more than five locations, schedule an annual signage audit that photographs every sign at every site against the CI specification. Score each site, track the scores over time, and correlate them with that site's sales performance data. You will find the relationship between signage quality and revenue is not theoretical.
Signage Measurement Methods Compared
There is no single right way to measure signage effectiveness. The method you use should match your budget, your data infrastructure, and the type of signage you are assessing. The table below compares the three most practical approaches for corporate and franchise operators in South Africa.
| Measurement Method | Best Suited For | Key Limitations |
|---|---|---|
| Before-and-after sales comparison: Record revenue, transaction count, and foot traffic for 4 to 8 weeks before and after installation. Calculate percentage change and attribute a portion to the signage. | Retail stores, restaurants, fitness centres, and any business with clear point-of-sale data. Works for static signs, LED-backlit fascias, and pylon installations. | Can be distorted by seasonal factors, promotional activity, or external events that coincide with installation. Requires a clean baseline period with no concurrent marketing changes. |
| Customer survey and recall testing: Conduct surveys in the catchment area before and after installation. Measure unaided brand recall, prompted recall, and visit intent among non-customers. Repeat at 3-month intervals. | Corporate identity rollouts, new branch openings, franchise refreshes, and businesses where the primary goal is brand awareness rather than immediate transaction uplift. | Requires a sample size large enough to be statistically valid (typically 100 to 200 respondents per wave). Has a time lag before results become meaningful. Cost of survey design and execution must be included in total project cost. |
| Cost-per-impression (CPI) benchmarking: Calculate total signage cost divided by total impressions over the asset life. Compare against CPI for equivalent advertising spend (print, digital, outdoor media). Present as a media efficiency ratio. | Corporate marketing teams justifying signage budget to a CFO or board. Particularly useful for pylon signage and outdoor-facing displays with high daily traffic exposure. | Impression count is an estimate, not a direct measurement. The quality of an impression (how long the viewer dwells, how relevant the message is) is not captured. CPI alone does not show conversion. Use alongside at least one conversion metric. |
Common Mistakes That Distort Your Signage ROI
Getting the measurement framework right matters more than picking the most sophisticated metrics. Several recurring errors cause businesses to either dramatically undervalue or overstate their signage investment returns.
Not setting a baseline before installation
This is the single most common and most costly mistake. Without a documented baseline of foot traffic, enquiry volume, and revenue performance in the weeks before installation, every post-installation result is an anecdote rather than a data point. You have no way to isolate the signage effect from natural business growth, seasonal variation, or simultaneous marketing activity. Set your baseline, document it, and protect it from noise by avoiding major promotions during the measurement window.
Treating signage as a one-time cost rather than an asset
A high-quality illuminated channel lettering installation or a well-fabricated pylon sign has a service life measured in years. The correct way to calculate ROI is to spread the total cost across the expected asset life and compare against annual benefits. Comparing a five-year asset's full capital cost against a single year's revenue benefit will always produce a misleading result.
Ignoring the cost of poor signage
A faded vinyl banner, a broken light in an illuminated sign, or a pylon display with outdated branding does not simply generate zero return. It actively damages brand perception and suppresses the performance of every other marketing investment you are making. The cost of under-maintained signage is real and belongs in any honest assessment of your signage portfolio's contribution to business performance.
Measuring only financial returns
For corporate environments, the business case for signage investment often rests partly on non-financial outcomes: employee experience, visitor first impressions, regulatory compliance (in sectors where clear signage is a safety or compliance requirement), and talent acquisition signalling. These outcomes have real financial consequences even when they do not show up directly in revenue data. A complete business signage investment evaluation includes a qualitative assessment of these factors, not just a revenue comparison.
For businesses in Gauteng looking to build a measurement-ready signage strategy, the starting point is always the same: work with a signage provider that understands both the fabrication and the business performance context of what they are installing. The sign is the output. The measured business impact is the product.
Frequently Asked Questions
What is a realistic ROI timeline for corporate signage in South Africa?
For retail and hospitality businesses with high foot traffic, a well-executed signage installation can reach breakeven within 6 to 12 months. Corporate office and B2B environments typically take 12 to 24 months to show measurable ROI, largely because the returns come through brand credibility and operational efficiency rather than direct transactional uplift. South Africa's commercial signage market is growing above the global average, which means competition for visual attention is increasing and the return on high-quality, well-placed signage is rising accordingly.
How do I calculate cost-per-impression for my business signage?
Divide your total signage cost (design, fabrication, installation, and maintenance over the asset life) by your total estimated impressions. Estimate daily impressions by multiplying the average daily foot or vehicle traffic past the sign by a display exposure probability factor, typically between 0.6 and 0.8 for clearly visible, well-positioned signage. Multiply by the number of days in your measurement period to get total impressions. This gives you a per-impression cost that you can directly compare against your digital, print, or outdoor media CPI for an honest media efficiency comparison.
What metrics should a franchise group track to measure signage ROI across multiple sites?
At a minimum, track foot traffic volume, average transaction value, new customer acquisition rate, and a corporate identity compliance score at each site. Run the same metrics at every location using the same methodology so that site-to-site comparisons are valid. Correlate CI compliance scores with revenue performance over time. Franchises that maintain consistent, high-specification signage across all locations consistently outperform those with ad-hoc or non-compliant signage on customer trust metrics, which translates into both repeat business and higher average transaction values.
Can I measure brand awareness impact from signage, or is it too intangible?
Brand awareness is measurable, but you need to design the measurement before installation rather than after. Conduct an unaided brand recall survey in your catchment area before the signage goes up. Repeat the survey at 3-month intervals post-installation. Track the percentage of respondents who mention your business without prompting. A lift in unaided recall is a direct, quantifiable outcome of signage visibility. For businesses with existing customer databases, you can also track whether returning customers increase their visit frequency after a signage refresh, which is a behavioural proxy for brand salience.
Should rental signage be included in ROI calculations?
Yes, absolutely. The ROI formula applies equally to owned and rented signage assets. For rental arrangements, the total cost is the cumulative rental spend over the measurement period, plus any installation or removal fees. The benefit side of the equation is identical to owned signage. In many cases, rental signage makes the ROI calculation simpler because the cost is predictable and period-based, which maps cleanly onto a monthly or quarterly return measurement. For event-based or short-term activations where you do not want to commit to a capital purchase, rental signage ROI can be measured over a single campaign period.
What is the most common error businesses make when evaluating signage effectiveness?
The most common error is the absence of a pre-installation baseline. Businesses frequently install new signage, see an improvement in performance over the following months, and attribute it to the signage without being able to prove the link. A four-to-eight week baseline measurement period before installation, capturing foot traffic, transaction volume, and enquiry rates, transforms a subjective impression into a documented business case. The second most common error is omitting installation and structural costs from the total cost calculation, which overstates ROI and leads to unreliable budget forecasting for future projects.
If you have measured signage ROI at your business or have a method that has worked particularly well in the South African market, share your experience in the comments below.
References
- How to measure signage ROI at venues: benchmarks, formulas, and best practices
- Key metrics for measuring signage ROI including foot traffic, brand recall, and CPI
- South Africa digital signage market growth and CAGR analysis
- How to measure the success of a digital signage strategy using KPIs and conversion data
- Digital signage ROI: payback period calculation and industry benchmarks by vertical